CARDIAC BOOTCAMP
  • HOME
  • Course Login
    • Log In
    • Log Out
  • SYLLABUS
  • STORE
    • Online Self Study Course
    • Cardiac Video Course
  • ECG OF THE WEEK

ECG OF THE WEEK

BECOME A COURSE MEMBER
Each Week we put up one ECG case for you....because it's easier to learn from cases.
The ECG of the week is FREE to everyone. To become an expert at ECG's join the Cardiac Bootcamp Course. It's a great way to Learn!
​Or come to one of our LIVE Cardiac Bootcamps

HYPERACUTE T WAVES: STEMI EQUIVALENT

23/3/2023

0 Comments

 
A 60 yo patient presents with chest pain. He has a past medical history of hypertension and high cholesterol and has diet-controlled diabetes.
He is haemodynamically stable, with a normal clinical examination.
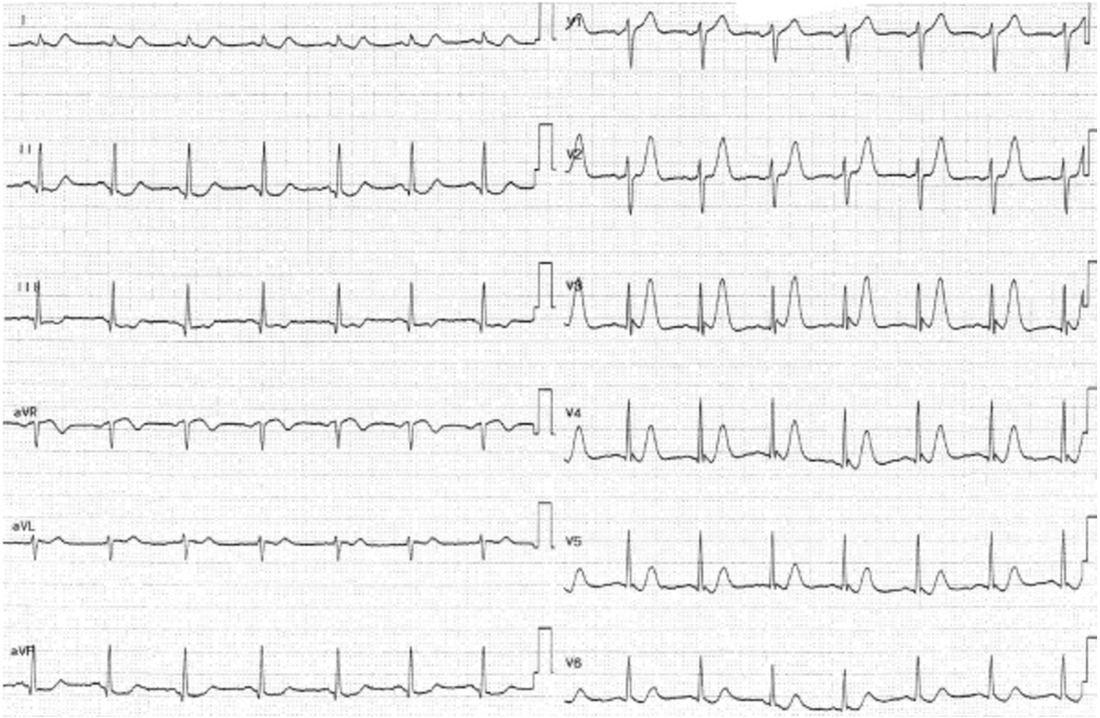
His ECG is shown below.
Picture
There are definitely hyper acute T waves. What does that actually mean? It's important to note that here is no formal definition of a hyper acute T wave. However it is not based on amplitude alone.
The hyper acute T wave is considered a STEMI-equivalent.

Koechlin L et al(1) conducted a post hoc analysis  of a multicenter diagnostic study and looked at the diagnostic performance of T wave amplitude for diagnosing myocardial infarction. They found that they were not useful in making this diagnosis.

One of the concerns is that they only looked at T wave amplitude. Smith(2) states that more than just amplitude is important to make the diagnosis. He refers to the T-wave 'bulk' The T wave is large in area, symmetric relative to the QRS.

The term " T wave towers" over the R wave in V3, or even that the QRS can fit into the T wave are important in terms of this 'bulk'.

References
  1. Koechlin L et al. Hyperacute T Wave in the Early Diagnosis of Acute Myocardial Infarction. Ann of Emerg Med.2022; 1-9
  2. Smit S et al. Hyperacute T-waves Can be a Useful Sign of Occlusion Myocardial Infarction if Appropriately Defined. Annals of Emerg Med. 2023;1-4
0 Comments

IS early depolarisation benign?

6/3/2023

0 Comments

 
This Blog was originally published on resus.com.au
Is Early Depolarisation benign? Several years ago we began to challenge this belief. Certainly in athletes it may be, however in the general population there has been an association with sudden cardiac death. Now ‘Hot of the Press’ is a new study reviewing the literature. In most cases early depolarisation is benign, however, there are cases where it has been associated with polymorphic ventricular tachycardia and ventricular fibrillation.
Below we look at the patterns that allow us to determine when it might be dangerous.

What is Early Repolarisation?
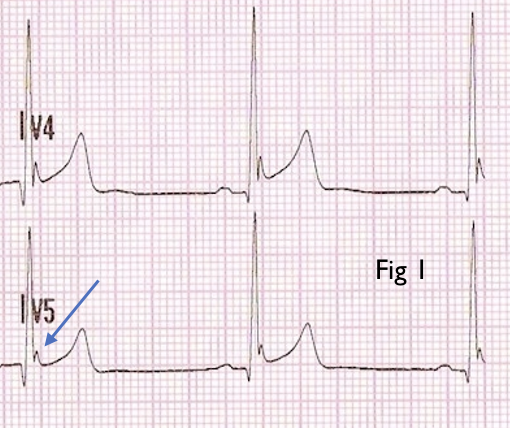
It is an electrocardiographic pattern (Fig 1) defined as:
  • J-point elevation of at least 1mm in > 1 inferior lead (II, III and aVF) and/or Lateral lead (I, aVL and V4-6) with either:
  • QRS slurring (smooth progression of terminal QRS to ST segment) or
  • Notching (positive deflection of S wave)
Picture
Characteristics of the dangerous pattern
There is an increased risk of arrhythmias and sudden cardiac death when:
  1. It occurs in young males
  2. There is a history of syncope. More than 25% of patients with early repolarisation had an episode of syncope
  3. Inferior early repolarisation patterns are associated with a greater risk of ventricular arrhythmias
  4. Particular ECG morphologies were associated with increased risk
    1. ST Segment Morphology: Higher arrhythmic risk occurred in those patients with
      1. Horizontal/descending ST-Segment in the inferior leads
        1. When combined with a >2mm J-point elevation, the risk is even higher.
      2. Notching of the terminal portion of the QRS is associated with a higher arrhythmic risk
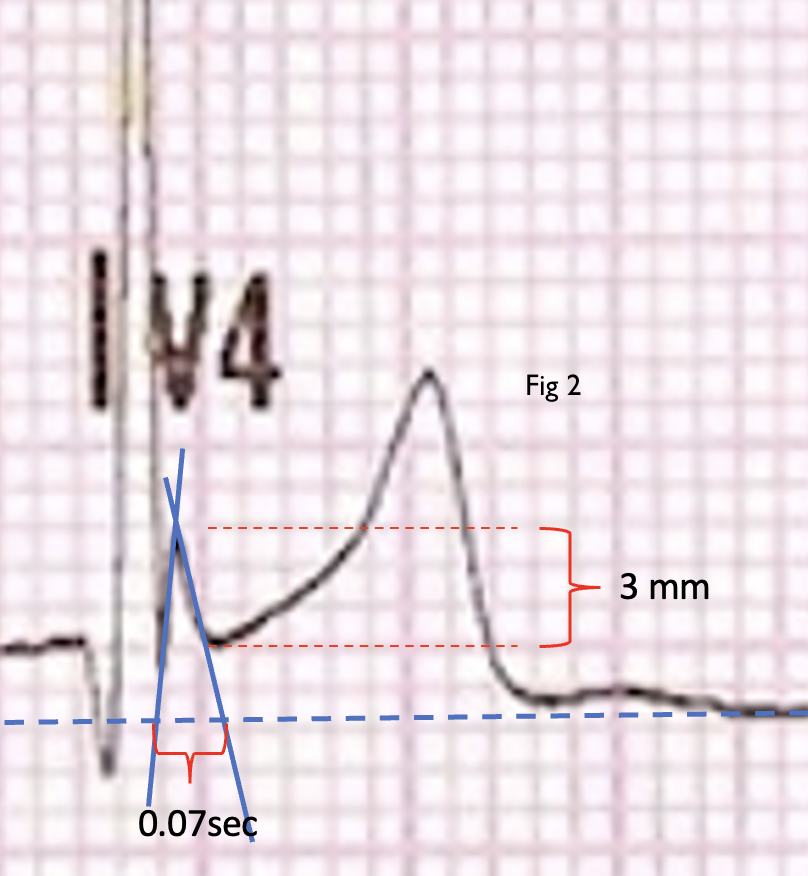
    2. J-point Amplitude, Duration and Slope (Fig 2)
      1. J-point elevation of at least 2mm was associated with a higher risk of death
      2. J-point duration is defined as the distance from J-point onset to where the Jpoint’s tangent intersects the isoelectric line. A longer duration increased the arrhythmic risk. In one study duration was 69.48 vs 35.05 ms.
      3. The J angle is the angle between an ideal line formed from the jpoint perpendicular to the isoelectric line and the tangent to the J wave. A wider angle (usually > 30 degrees) increases arrhythmic risk.
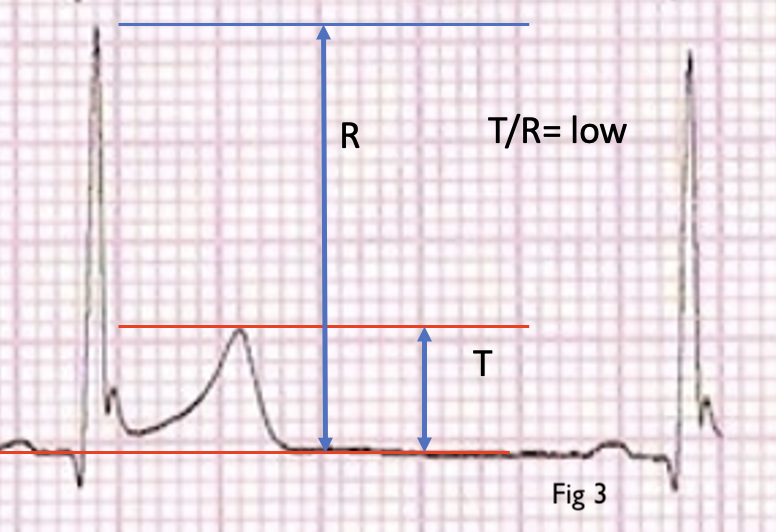
    3. T wave Morphology
      1. Usually T waves had low amplitude
      2. There was a low T wave/R wave ratio in leads II and V5 (Fig 3)
    4. Q waves and T wave inversions were also found to contribute to arrhythmic risk.
    5. There may be an association with coronary artery disease and other channelopathies.
Picture
Picture
Management of Patients with Early Depolarisation
Most patients with isolated early repolarisation require no treatment. Patients who require an implantable defibrillator include:
  • Patients surviving ventricular arrhythmias
  • Patients with a family history of sudden cardiac death and early repolarisation patterns
  • Patients with syncope and early repolarisation
  • Those with high risk ECG patterns as discussed above.


References
El-Azrak M et al. Sudden Cardiac Death Risk Stratification of the Early Repolarization Syndrome: An Updated Review of the Literature.
0 Comments

A patient with post ablation dizziness

3/3/2023

0 Comments

 
CASE
A 59 yo male presents to the Emergency Department, 5 days post ablation for atrial fibrillation. He is complaining of dizziness and nausea. He is also seeing spots before his eyes.
​He has no other past medical history and is on a DOAC and Sotalol
His BP is 122/68 with no postural drop and his pulse rate is 49 bpm.
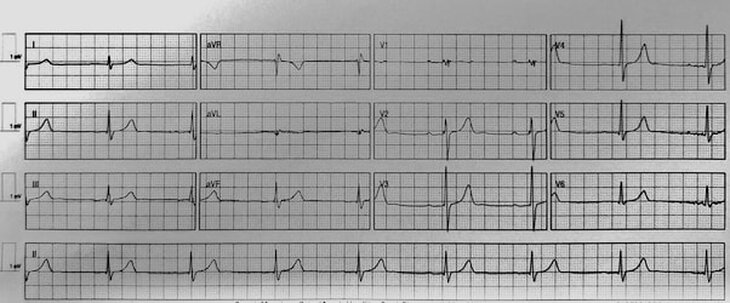
​His ECG is shown below. What does the ECG show? (HINT: The exam is the key)
Picture
The ECG is sinus bradycardia at a rate of 49 with a first degree block. Not much to see.

The examination showed:
  • Dual Heart Sounds, with no extra sounds
  • Chest clear
  • Abdomen soft
  • Given his dizziness, his neurological examination as per the 'Dizzy Patient' algorithm on the RESUS blog.
    • His Cranial Nerve exam showed
      • No nystagmus, no diplopia and pupils equal and reactive.
      • On visual fields he stated he saw some spots before his eyes but no 'floaters'. He also stated that in his peripheral vision he saw a 'kaleidoscope' pattern of colours.
      • Fundoscopy was normal
      • Facial nerve examination was normal and there was no speech disturbance
    • Given that he had no nystagmus, head impulse test was fruitless to do, but done anyway and was negative. Dix-Hallpike was also performed and was normal.
    • Cerebellar examination was normal
    • Upper and lower limb neurological examination was normal

What's the diagnosis?

I'll add that I did a non-contrast CT brain on him, purely because he was on a DOAC. This was normal.
Approximately one hour later the patient had improved and felt well.

What's your initial thinking and diagnosis?
​My initial thinking was as follows:
  • This might be Sotalol related, as it can produce dizziness and nausea. Alternatively the dose he was on (80mg bd) may have been too high.
  • Second thought was that this might be a peripheral vestibulopathy, but all the examinations were normal, head impulse test and Dix-Hallpike. Also with no nystagmus and dizziness, a central cause should be more likely.
  • Could this be a bleed, because he was on a DOAC?
  • It didn't sound like a stroke.
  • The kaleidoscope colours and spots before his eyes sounded like a migraine, but he was not a migraine sufferer.
I initially spoke with the neurologist who agreed that it sounded migrainous and did not think he needed an MRI. I then spoke with his electrophysiologist ....
"I've got Mr X with us, who had the ablation 5 days ago. He's come in with nausea and dizziness. His ECG is normal and he is haemodynamically fine. His neurological exam looking for a peripheral or central cause is normal. The only thing I can say is that he has this kaleidoscope vision and to me, this points to a migraine, but he isn't a migraine sufferer."

The Diagnosis
The electrophysiologist said "This is a post ablation migraine".

The literature shows that a percentage of patients, up to 2%, (thought to be even higher), present with migraines, usually with no headache but aura and visual disturbances. These visual disturbances include scotomas and scintillating edges to vision. Attacks occur within one week of the ablation and usually resolve within 3 months.
The reason appears to be that during catheter ablation for atrial fibrillation, a transeptal puncture is required to provide access to the left atrium. This provides access to the pulmonary veins. The result is that it creates a transient right to left shunt.
The exact mechanism for why this might then occur is unknown, but can include factors usually cleared by the lungs, now reaching the cerebral circulation, and even microemboli. It is usually transient and no specific treatment is needed if there is no neurology and the patient is on anticoagulation. If abnormal neurology is found, then the patient should definitely be discussed with neurology. 

We see a lot of post ablation patients, given that atrial fibrillation is now becoming such a massive arrhythmia burden, that we will see post ablation migraines.

The patient was well and all symptoms (which did not involve any significant neurology) had resolved, he was discharged, to be reviewed by his cardiologist.
References
  1. Noheria A et al. Migraine headaches following catheter ablation for atrial fibrillation. Journal of Interventional Cardiac Electrophysiology 2011; 30:227–232 
  2. Kato Y et al. Migraine-like Headache after Transseptal Puncture for Catheter Ablation: A Case Report and Review of the Literature. Intern Med 2019;58(16):2393-2395
0 Comments

    Author

    Dr Peter Kas
    ​Emergency Physician

    Back to resus.com.au
    Picture
    Picture
    Sign up for
    ECG of the week
     Its free

    Archives

    May 2023
    March 2023
    February 2023
    January 2023
    December 2022
    November 2022
    October 2022
    September 2022
    August 2022
    July 2022
    June 2022
    March 2022
    December 2021
    November 2021
    October 2021
    September 2021
    August 2021
    July 2021
    June 2021
    May 2021
    April 2021
    March 2021
    February 2021
    January 2021
    December 2020
    November 2020
    September 2020
    August 2020
    July 2020

    Categories

    All
    Ablation
    Atrial Fibrillation
    Atrial Flutter
    Atrial Tachycardia
    Axis
    Bradycardia
    Cardiac Arrest
    Chest Pain
    ECG Mimics
    Ischaemia
    Lead Reversal
    Migraine
    Myopericarditis
    Pacing
    Paediatric Arrhythmias
    Paediatric ECG
    Paediatric Syncope
    Pericarditis
    QT Interval
    STEMI
    STEMI Mimics
    SVT
    T Waves
    Ventricular Tachycardia
    Wellens
    Wide Complex Tachycardia

Our Other Websites to Visit

www.emcore.com.au
www.resus.com.au

Contact Us
© COPYRIGHT 2015. ALL RIGHTS RESERVED.
  • HOME
  • Course Login
    • Log In
    • Log Out
  • SYLLABUS
  • STORE
    • Online Self Study Course
    • Cardiac Video Course
  • ECG OF THE WEEK