CARDIAC BOOTCAMP
  • HOME
  • Course Login
    • Log In
    • Log Out
  • SYLLABUS
  • STORE
    • Online Self Study Course
    • Cardiac Video Course
  • ECG OF THE WEEK

ECG OF THE WEEK

BECOME A COURSE MEMBER
Each Week we put up one ECG case for you....because it's easier to learn from cases.
The ECG of the week is FREE to everyone. To become an expert at ECG's join the Cardiac Bootcamp Course. It's a great way to Learn!
​Or come to one of our LIVE Cardiac Bootcamps

The Non-Specific T wave abnormality

16/5/2023

1 Comment

 
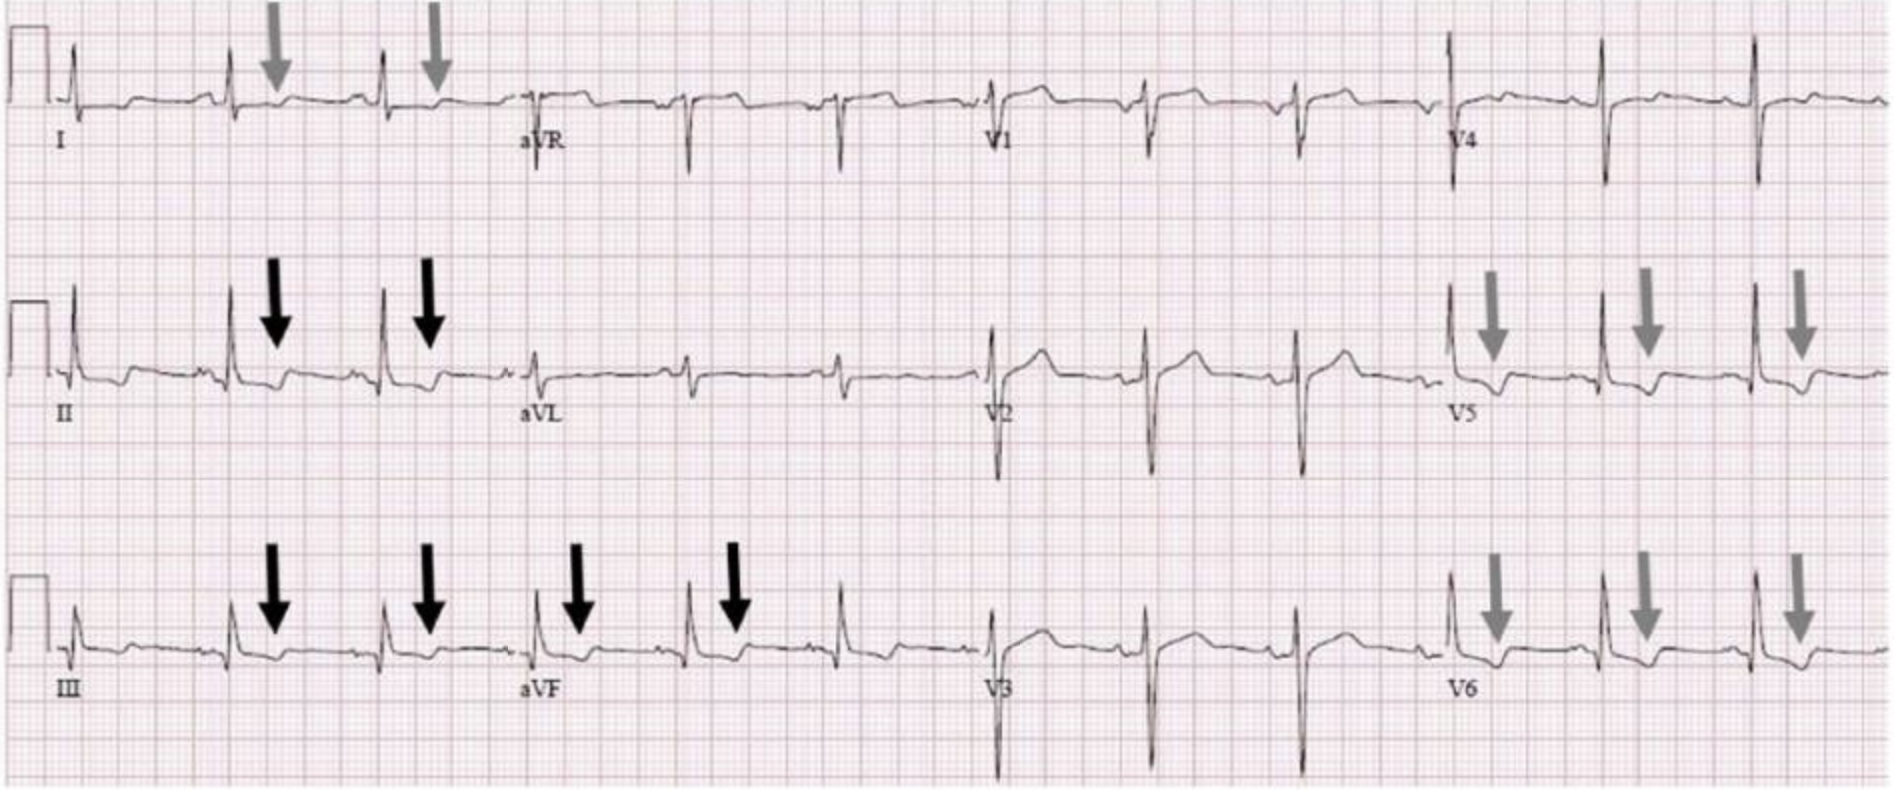
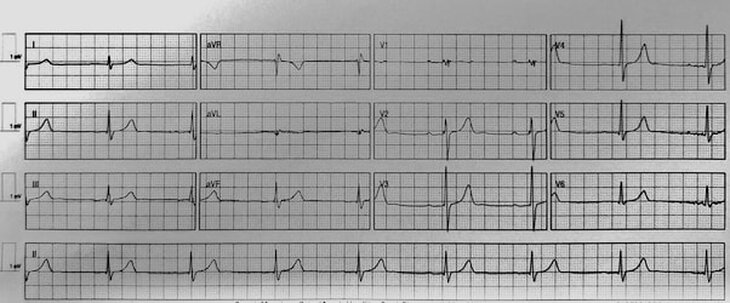
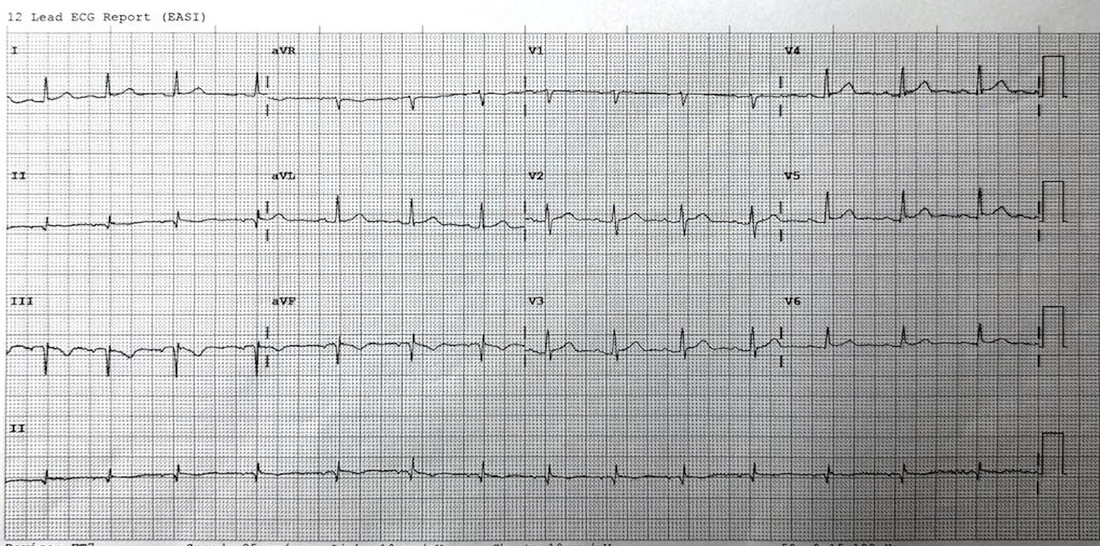
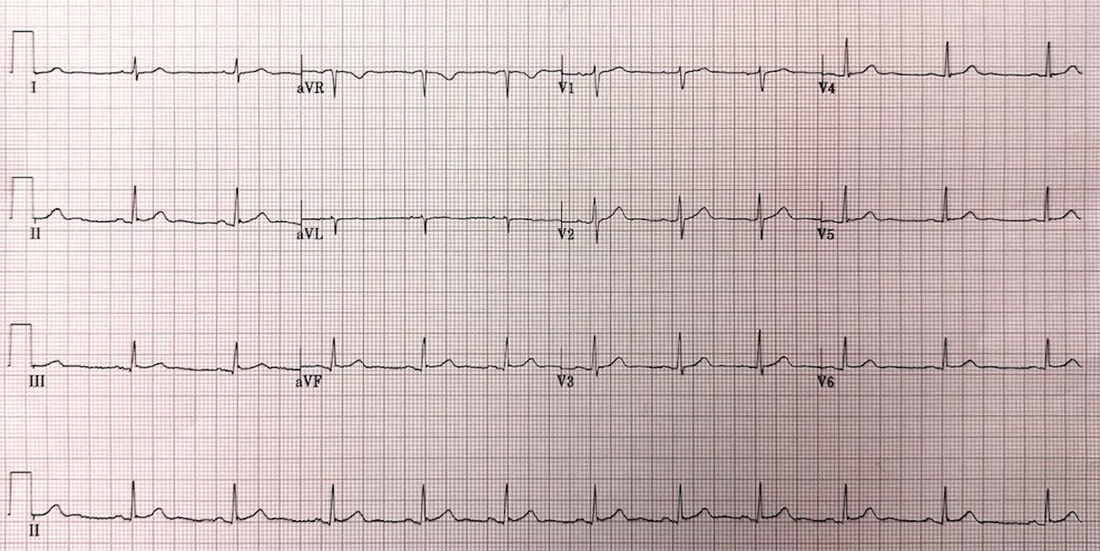
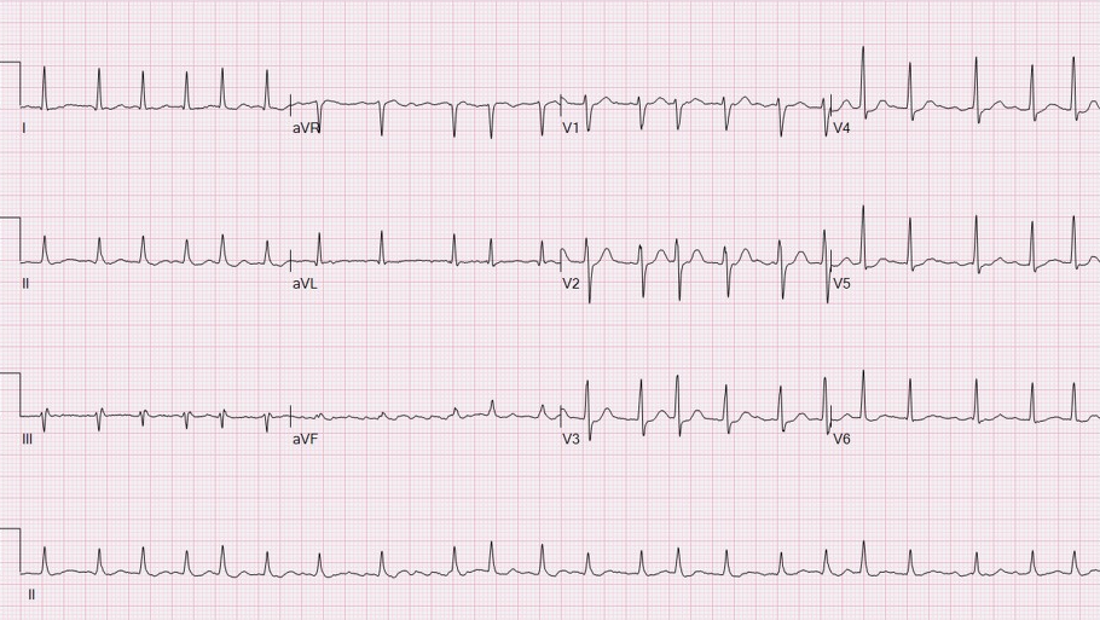
A 72 yo male patient presents with chest pain. The pain is sharp and is worst on lying down. There is a past history of hypertension, high cholesterol and a family history of heart disease. ​An ECG is done and shown below (1).
Picture
T wave inversion in the Inferior and Lateral leads
The ECG is normal except for some non-specific T wave changes in the inferior and lateral leads. What do we do with these changes? Is this inferolateral ischaemia? This patient has ECG changes so needs to be worked up as per a chest pain stratification and pathway tool. Is there anything more that we can do to work out if these changes are cardiac in origin?

What are non-specific T wave changes?
They occur in about 1% of patients and  include T wave flattening and T wave inversion with no other changes necessarily present. 
Causes include(1):
  • Myocardial Infarction
  • Myocarditis
  • Mitral valve prolapse
  • Ventricular Strain.
Can changes be due to respiration?
Respiration results in a change in heart position. The heart rotates in a clockwise direction  in inspiration and anticlockwise in expiration. This can cause T wave changes. Inspiration also produces diaphragmatic movement, which can cause T wave changes (2)
A 2017 case report(1) looked at one case where non-specific T wave changes had a respiratory cause and recommends we look for this.
The authors recommend that:
  1. An ECG be performed with the breath held in deep inspiration and
  2. A second ECG be performed with the breath held in in expiration.
A change in the polarity of the T waves with respiration may indicate a non-cardiac cause is more likely.

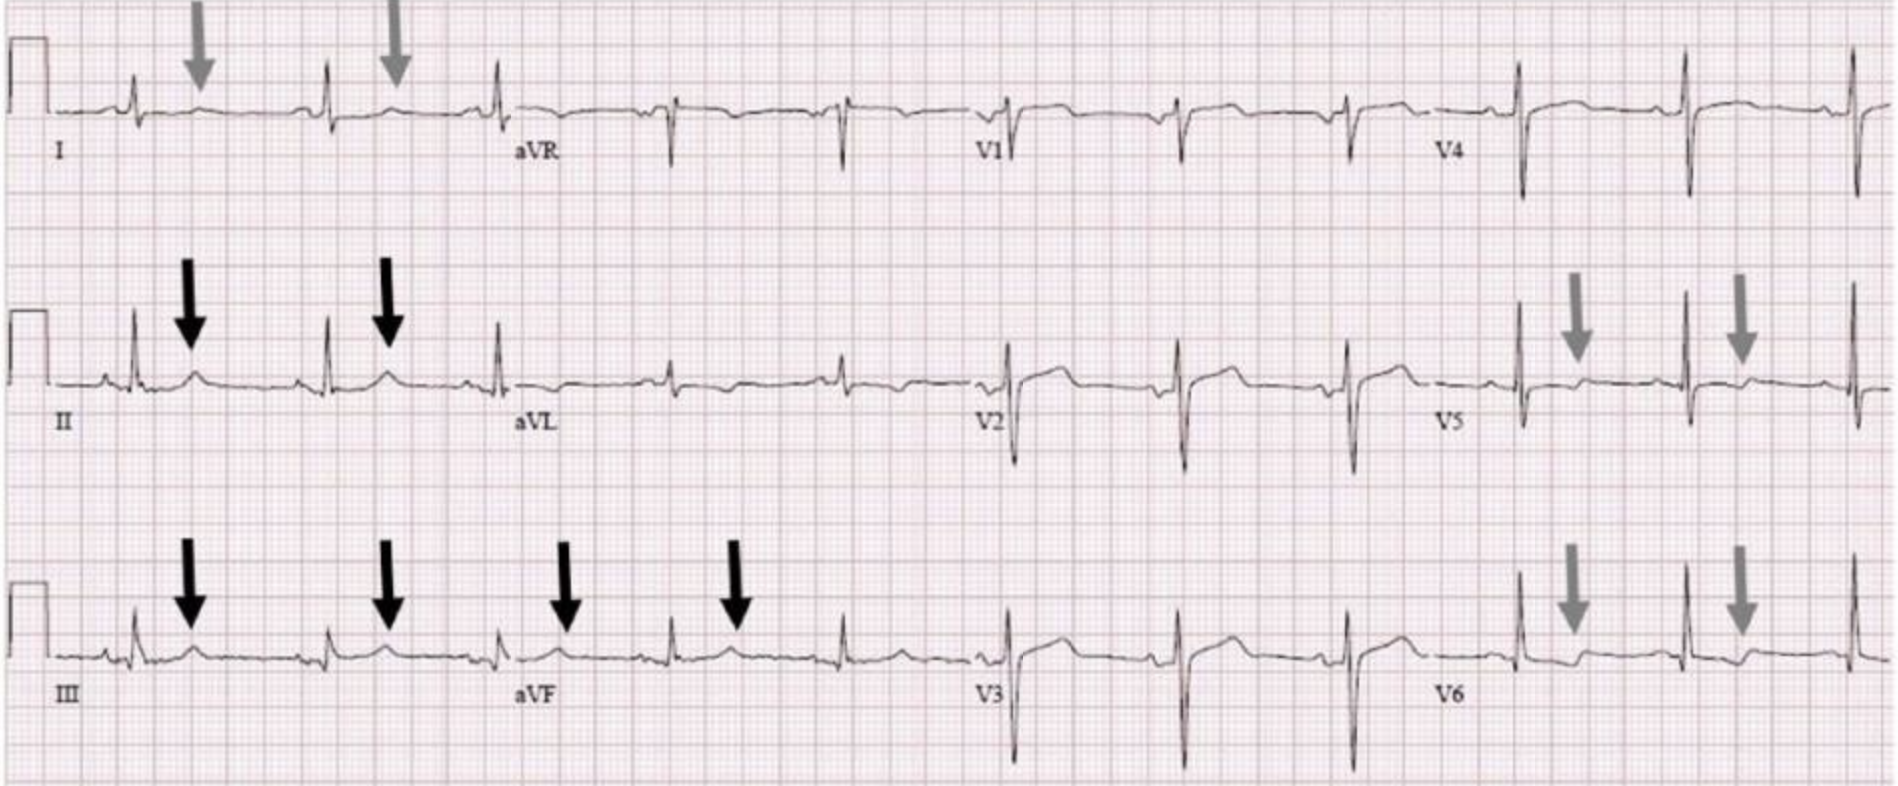
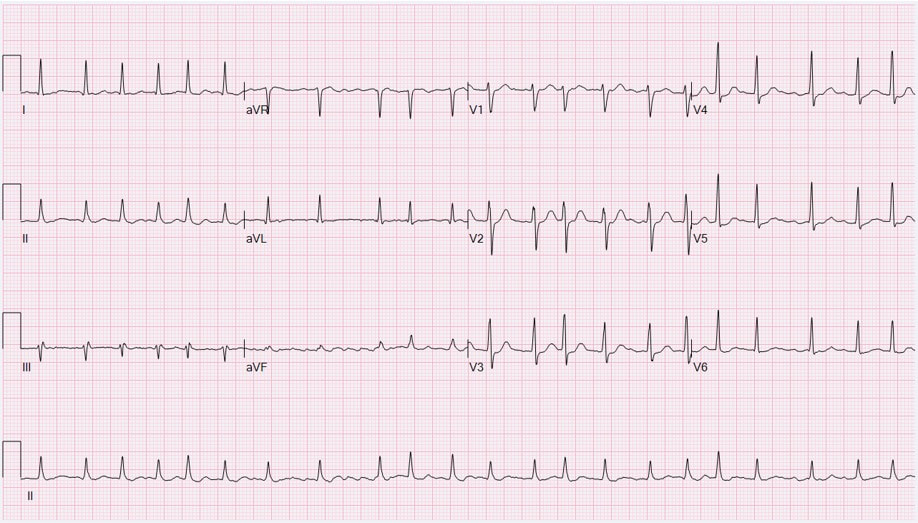
The ECG below was done in inspiration.
Picture
In this ECG, the patient holds their breath at the end of inspiration.
In the above ECG, the T waves in the inferior leads are now upright. The T wave morphology has also changed in the lateral leads.
This indicates a potential respiratory cause.
We must beware however, as this patient has risk factors and is not really low risk:
  1. If we applied a Heart Score to this patient, it would be 5 even if the troponin were normal, so a moderate risk.
  2. If EDACS was applied, again they are not a low risk patient.
This patient would still benefit from serial troponins and being assessed on a chest pain pathway.
​
References
  1. Sharma H and Tiwari A. Respiratory T-Wave inversion in a Patient With Chest Pain. Clinical Medicine Insights: Case reports. 2017;10: 1-3
  2. Dougherty JD. The relation of respiratory changes in the horizontal QRS and T-wave axes to movement of the thoracic electrodes. J Electrocardiol. 1970;3:77–86.
1 Comment

HYPERACUTE T WAVES: STEMI EQUIVALENT

23/3/2023

0 Comments

 
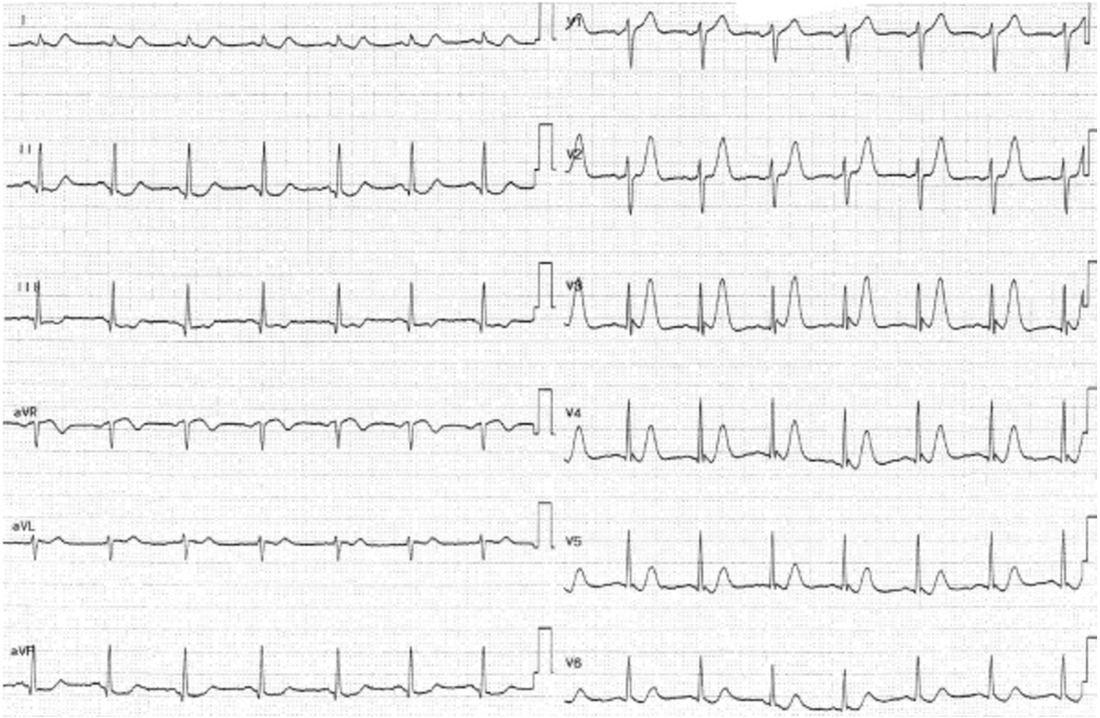
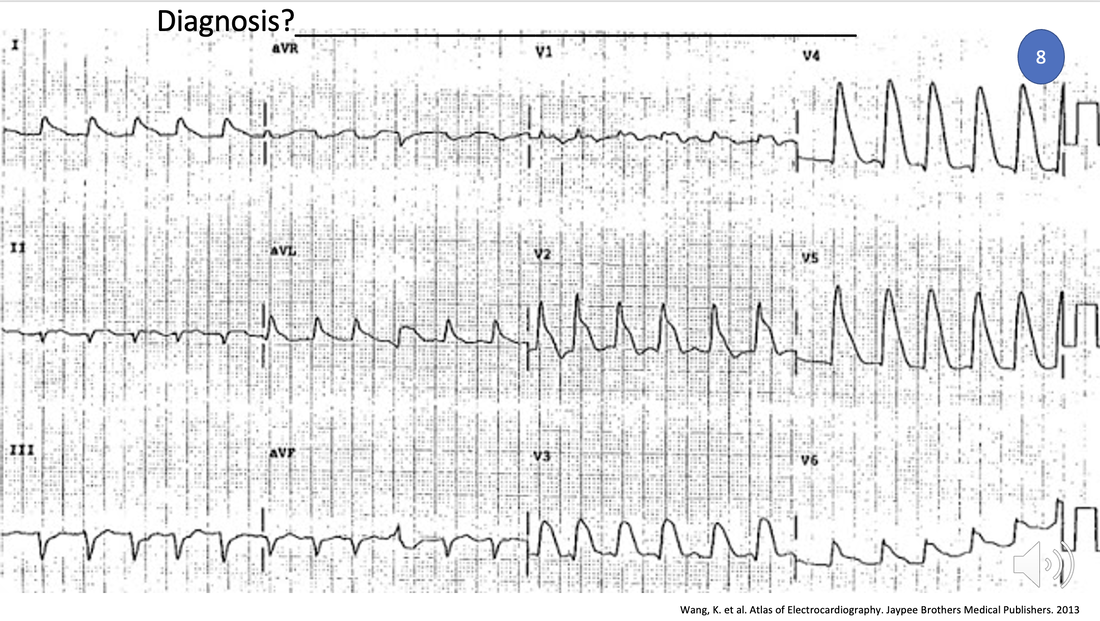
A 60 yo patient presents with chest pain. He has a past medical history of hypertension and high cholesterol and has diet-controlled diabetes.
He is haemodynamically stable, with a normal clinical examination.
His ECG is shown below.
Picture
There are definitely hyper acute T waves. What does that actually mean? It's important to note that here is no formal definition of a hyper acute T wave. However it is not based on amplitude alone.
The hyper acute T wave is considered a STEMI-equivalent.

Koechlin L et al(1) conducted a post hoc analysis  of a multicenter diagnostic study and looked at the diagnostic performance of T wave amplitude for diagnosing myocardial infarction. They found that they were not useful in making this diagnosis.

One of the concerns is that they only looked at T wave amplitude. Smith(2) states that more than just amplitude is important to make the diagnosis. He refers to the T-wave 'bulk' The T wave is large in area, symmetric relative to the QRS.

The term " T wave towers" over the R wave in V3, or even that the QRS can fit into the T wave are important in terms of this 'bulk'.

References
  1. Koechlin L et al. Hyperacute T Wave in the Early Diagnosis of Acute Myocardial Infarction. Ann of Emerg Med.2022; 1-9
  2. Smit S et al. Hyperacute T-waves Can be a Useful Sign of Occlusion Myocardial Infarction if Appropriately Defined. Annals of Emerg Med. 2023;1-4
0 Comments

IS early depolarisation benign?

6/3/2023

0 Comments

 
This Blog was originally published on resus.com.au
Is Early Depolarisation benign? Several years ago we began to challenge this belief. Certainly in athletes it may be, however in the general population there has been an association with sudden cardiac death. Now ‘Hot of the Press’ is a new study reviewing the literature. In most cases early depolarisation is benign, however, there are cases where it has been associated with polymorphic ventricular tachycardia and ventricular fibrillation.
Below we look at the patterns that allow us to determine when it might be dangerous.

What is Early Repolarisation?
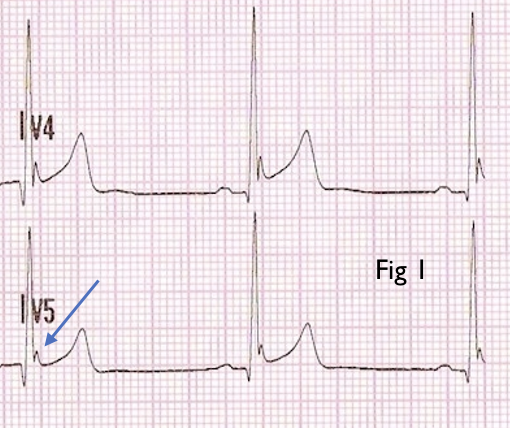
It is an electrocardiographic pattern (Fig 1) defined as:
  • J-point elevation of at least 1mm in > 1 inferior lead (II, III and aVF) and/or Lateral lead (I, aVL and V4-6) with either:
  • QRS slurring (smooth progression of terminal QRS to ST segment) or
  • Notching (positive deflection of S wave)
Picture
Characteristics of the dangerous pattern
There is an increased risk of arrhythmias and sudden cardiac death when:
  1. It occurs in young males
  2. There is a history of syncope. More than 25% of patients with early repolarisation had an episode of syncope
  3. Inferior early repolarisation patterns are associated with a greater risk of ventricular arrhythmias
  4. Particular ECG morphologies were associated with increased risk
    1. ST Segment Morphology: Higher arrhythmic risk occurred in those patients with
      1. Horizontal/descending ST-Segment in the inferior leads
        1. When combined with a >2mm J-point elevation, the risk is even higher.
      2. Notching of the terminal portion of the QRS is associated with a higher arrhythmic risk
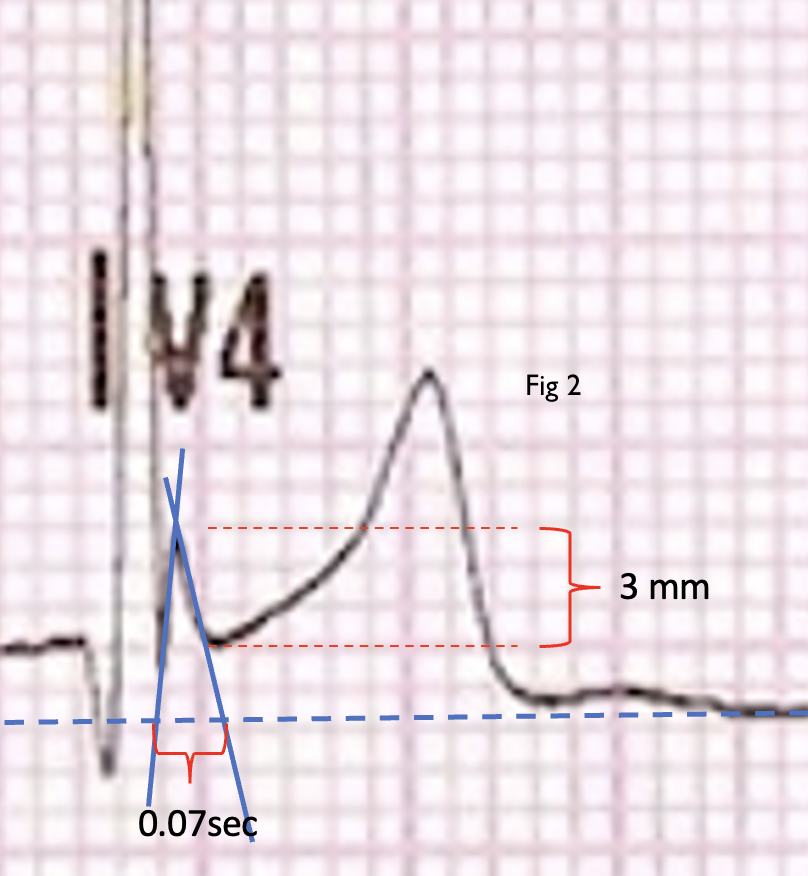
    2. J-point Amplitude, Duration and Slope (Fig 2)
      1. J-point elevation of at least 2mm was associated with a higher risk of death
      2. J-point duration is defined as the distance from J-point onset to where the Jpoint’s tangent intersects the isoelectric line. A longer duration increased the arrhythmic risk. In one study duration was 69.48 vs 35.05 ms.
      3. The J angle is the angle between an ideal line formed from the jpoint perpendicular to the isoelectric line and the tangent to the J wave. A wider angle (usually > 30 degrees) increases arrhythmic risk.
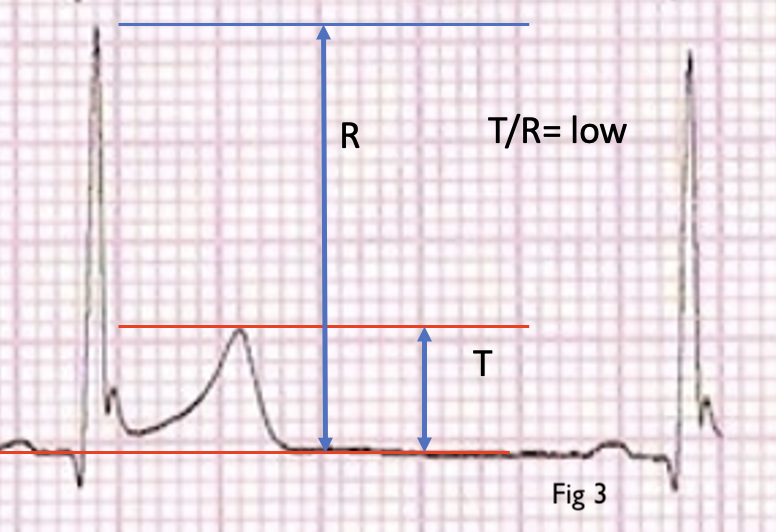
    3. T wave Morphology
      1. Usually T waves had low amplitude
      2. There was a low T wave/R wave ratio in leads II and V5 (Fig 3)
    4. Q waves and T wave inversions were also found to contribute to arrhythmic risk.
    5. There may be an association with coronary artery disease and other channelopathies.
Picture
Picture
Management of Patients with Early Depolarisation
Most patients with isolated early repolarisation require no treatment. Patients who require an implantable defibrillator include:
  • Patients surviving ventricular arrhythmias
  • Patients with a family history of sudden cardiac death and early repolarisation patterns
  • Patients with syncope and early repolarisation
  • Those with high risk ECG patterns as discussed above.


References
El-Azrak M et al. Sudden Cardiac Death Risk Stratification of the Early Repolarization Syndrome: An Updated Review of the Literature.
0 Comments

A patient with post ablation dizziness

3/3/2023

0 Comments

 
CASE
A 59 yo male presents to the Emergency Department, 5 days post ablation for atrial fibrillation. He is complaining of dizziness and nausea. He is also seeing spots before his eyes.
​He has no other past medical history and is on a DOAC and Sotalol
His BP is 122/68 with no postural drop and his pulse rate is 49 bpm.
​His ECG is shown below. What does the ECG show? (HINT: The exam is the key)
Picture
The ECG is sinus bradycardia at a rate of 49 with a first degree block. Not much to see.

The examination showed:
  • Dual Heart Sounds, with no extra sounds
  • Chest clear
  • Abdomen soft
  • Given his dizziness, his neurological examination as per the 'Dizzy Patient' algorithm on the RESUS blog.
    • His Cranial Nerve exam showed
      • No nystagmus, no diplopia and pupils equal and reactive.
      • On visual fields he stated he saw some spots before his eyes but no 'floaters'. He also stated that in his peripheral vision he saw a 'kaleidoscope' pattern of colours.
      • Fundoscopy was normal
      • Facial nerve examination was normal and there was no speech disturbance
    • Given that he had no nystagmus, head impulse test was fruitless to do, but done anyway and was negative. Dix-Hallpike was also performed and was normal.
    • Cerebellar examination was normal
    • Upper and lower limb neurological examination was normal

What's the diagnosis?

I'll add that I did a non-contrast CT brain on him, purely because he was on a DOAC. This was normal.
Approximately one hour later the patient had improved and felt well.

What's your initial thinking and diagnosis?
​My initial thinking was as follows:
  • This might be Sotalol related, as it can produce dizziness and nausea. Alternatively the dose he was on (80mg bd) may have been too high.
  • Second thought was that this might be a peripheral vestibulopathy, but all the examinations were normal, head impulse test and Dix-Hallpike. Also with no nystagmus and dizziness, a central cause should be more likely.
  • Could this be a bleed, because he was on a DOAC?
  • It didn't sound like a stroke.
  • The kaleidoscope colours and spots before his eyes sounded like a migraine, but he was not a migraine sufferer.
I initially spoke with the neurologist who agreed that it sounded migrainous and did not think he needed an MRI. I then spoke with his electrophysiologist ....
"I've got Mr X with us, who had the ablation 5 days ago. He's come in with nausea and dizziness. His ECG is normal and he is haemodynamically fine. His neurological exam looking for a peripheral or central cause is normal. The only thing I can say is that he has this kaleidoscope vision and to me, this points to a migraine, but he isn't a migraine sufferer."

The Diagnosis
The electrophysiologist said "This is a post ablation migraine".

The literature shows that a percentage of patients, up to 2%, (thought to be even higher), present with migraines, usually with no headache but aura and visual disturbances. These visual disturbances include scotomas and scintillating edges to vision. Attacks occur within one week of the ablation and usually resolve within 3 months.
The reason appears to be that during catheter ablation for atrial fibrillation, a transeptal puncture is required to provide access to the left atrium. This provides access to the pulmonary veins. The result is that it creates a transient right to left shunt.
The exact mechanism for why this might then occur is unknown, but can include factors usually cleared by the lungs, now reaching the cerebral circulation, and even microemboli. It is usually transient and no specific treatment is needed if there is no neurology and the patient is on anticoagulation. If abnormal neurology is found, then the patient should definitely be discussed with neurology. 

We see a lot of post ablation patients, given that atrial fibrillation is now becoming such a massive arrhythmia burden, that we will see post ablation migraines.

The patient was well and all symptoms (which did not involve any significant neurology) had resolved, he was discharged, to be reviewed by his cardiologist.
References
  1. Noheria A et al. Migraine headaches following catheter ablation for atrial fibrillation. Journal of Interventional Cardiac Electrophysiology 2011; 30:227–232 
  2. Kato Y et al. Migraine-like Headache after Transseptal Puncture for Catheter Ablation: A Case Report and Review of the Literature. Intern Med 2019;58(16):2393-2395
0 Comments

A 19yo with palpitations and atypical chest pain

24/2/2023

1 Comment

 
A 19yo presents with a complaint of palpitations lasting several seconds and some chest tightness that lasts a few minutes, but is gone when the patient retracts his arms posteriorly to stretch his chest.
His ECG shows inverted T wave inferiorly. A high sensitivity troponin is sent and comes back normal. The ECG is shown below.
What does the ECG show?
(a) Acute Inferior Infarction
(b) Old Inferior infarction
(c)  Pericarditis
​(d) None of the above

​What would you do next?
Picture
ANSWER
This is an ECG we have covered before in one form or another.
The answer is (d)
When looking at the ecg and using the 'ECG in 20 Seconds' approach it shows:
Rate:84 bpm
Rhythm: Sinus rhythm
P axis: the p wave is upright in aVR and inverted in lead II- therefore this is LIMB LEAD REVERSAL. In a normal P wave axis ie., sinus rhythm, the p wave must be upright in II and inverted in aVR.

When the leads are correctly placed the following ECG was obtained:
Picture
This is normal sinus rhythm with no ischaemic changes.
Troponin was normal. It was repeated and still normal. 
The Heart Score was low indicating a low risk patient.
1 Comment

A 12 yo boy with Syncope

13/2/2023

0 Comments

 
A 12 yo boy presents with an episode of syncope during exertion exercise. Whilst in the emergency department he develops palpitations and an ecg is done. His ecg is shown below.
Picture
Keone R et al. Journal of Arrhythmia 33 (2017) 533–544
What is the diagnosis?
Is this a benign arrhythmia in childhood?
SOLUTION
This is bidirectional ventricular tachycardia, similar to what may occur, with digoxin toxicity.
In this case it is it is Catecholamine induced polymorphic tachycardia.
This is an inherited condition, that if untreated carries a 30% mortality.
It is a stress induced tachycardia that can lead to syncope or cardiac arrest and patients can suffer a VF arrest or sudden cardiac death.
​Treatment is initially with a beta blocker such as Propranolol, Atenolol or Nadolol. If this fails to control the arrhythmia an implantable defibrillator may be needed.
MEMBERS Login and read the new section just added on PAEDIATRIC ARRHYTHMIAS

The Cardiac Video Course
The FULL ONLINE COURSE which includes the Cardiac Video Course
0 Comments

A 35 yo with sharp chest pain

7/2/2023

0 Comments

 
​A 35 yo patient presents with sharp central chest pain, that he has had since yesterday and has become worst.
The pain does not radiate and improves when he sits up.
He has no other symptoms and no other medical history.
Examination is essentially normal.
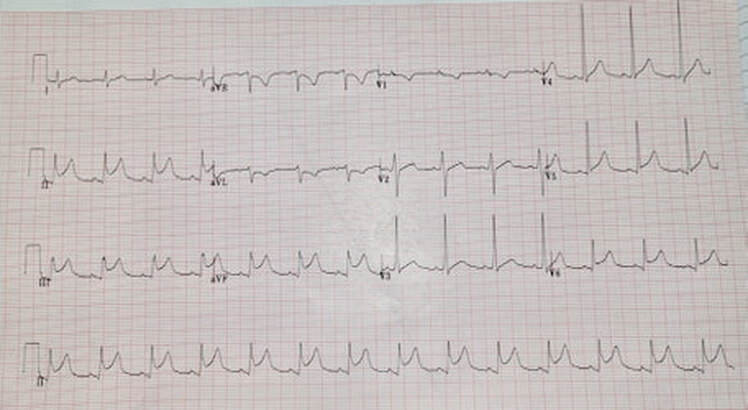
His ECG is shown below;
Picture
What does the ECG show?
ANSWER
There are changes consistent with pericarditis. (MEMBERS Login and go to the section on PERICARDITIS)
There is widespread ST elevation, with the ST elevation in III being less than in II
​There is also PR depression and no reciprocal changes, although there is T wave inversion in aVL.
The patients troponin returns and is 8000ng/L.

Which of the following would you do in this 35 yo?:
(a) Activate the Cath lab, or if you don't have one transfer to a Cath lab equiped hospital
(b) Thrombolyse if no Cath lab
(c)  Get an ECHO
(d) Do a serial Troponin

Is there a difference between Myopericarditis and Perimyocarditis?
The answer is YES there is.
​Myopericarditis has a good prognosis and no left ventricular involvement.
MEMBERS login and go to the Pericarditis and Myopericarditis sections
0 Comments

The Last ECG of the Bootcamp Quiz

25/1/2023

0 Comments

 
Hello Everyone
As the dust settles from the last EMCORE Conference e and as we start to prepare for the next ones in Singapore, London, Bali and Fiji, there is one ECG we did not cover in the quiz, that is important to discuss.
​The ECG below was the last in the Quiz.
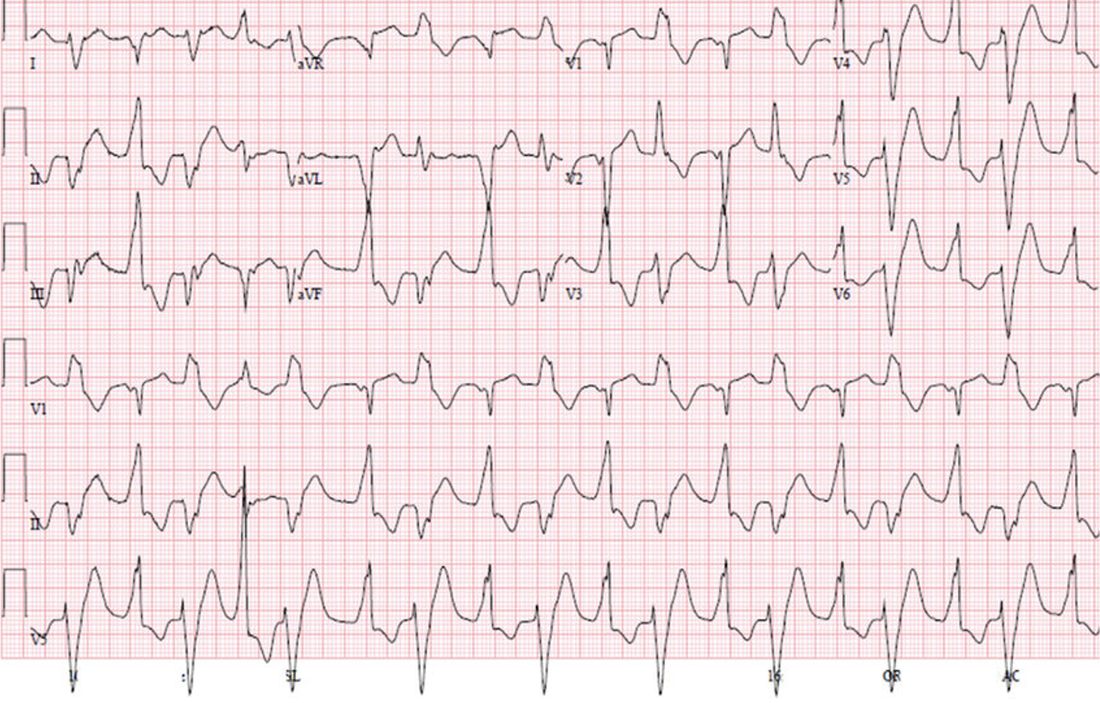
I did not give you a history at all, but that is the key here...diagnose with no history. I could add that this is a 67 yo patient with a presentation of SOB, chest tightness and palpitations.
Picture
What is the Diagnosis?
(a) Ventricular Tachycardia
(b) Hyperkalaemia
(c) Anterolateral MI
(d) SVT with Bundle Branch Block
The Answer is......
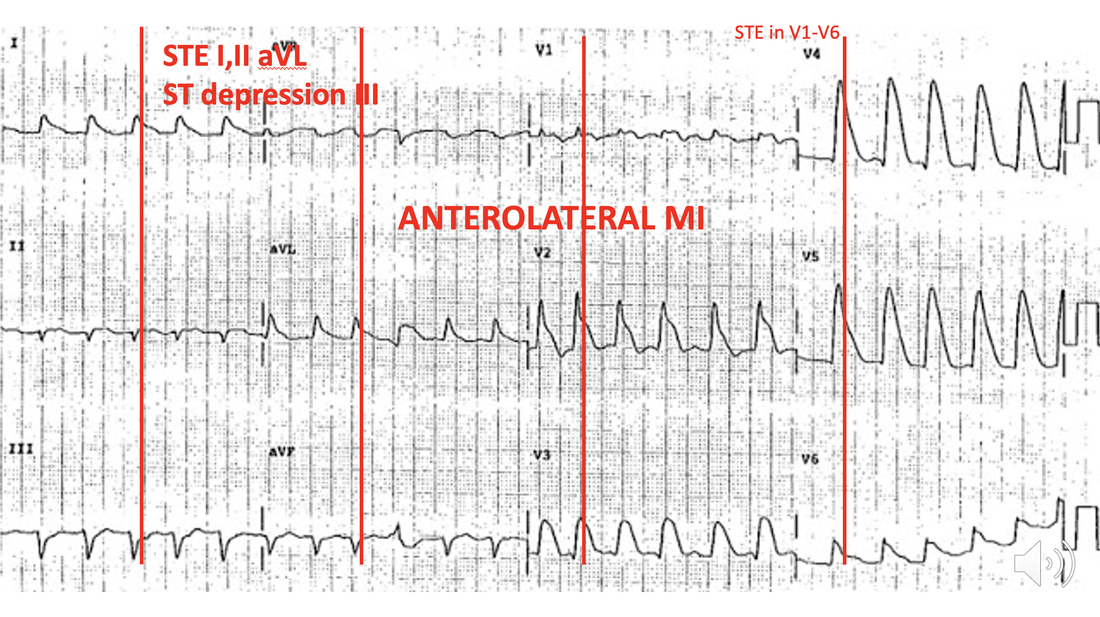
(c)  Anterolateral MI
It simply looks ischaemic
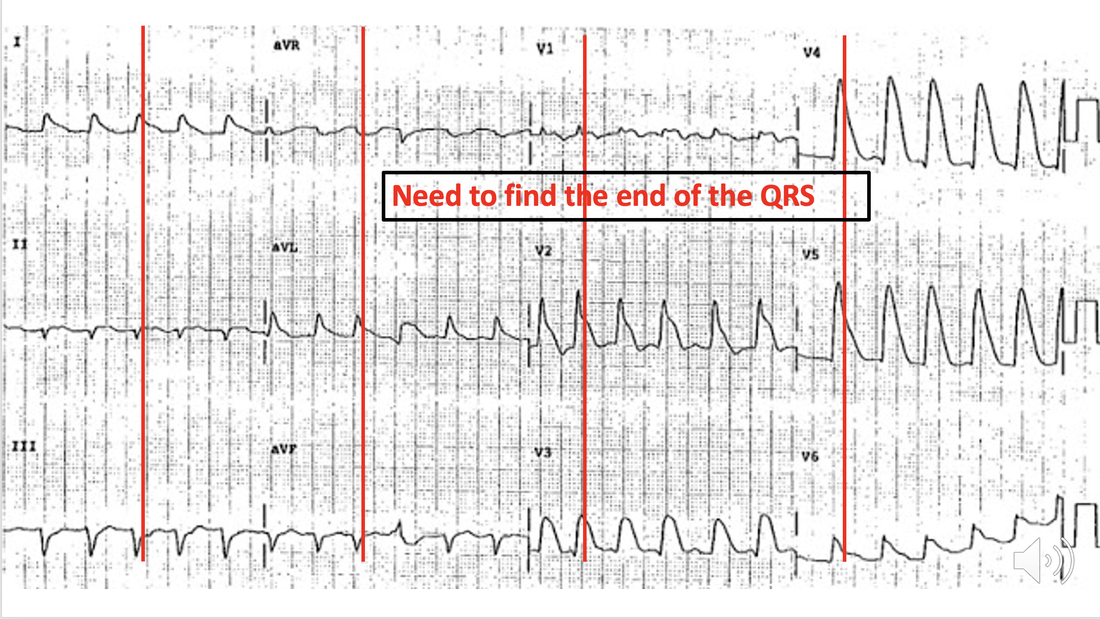
​The first thing to do is find where the QRS ends. See below.
Let's draw lines at where the QRS ends. This is the same process as we used in the 'Shark Fin' ECG (Blog coming next week).
Picture
When we do this we can see the ST elevation and the depression.
​With that marked, we see that it is an anterolateral MI. See below and watch the brief video.
Picture
0 Comments

A Patient with Atrial Fibrillation: Shock now?

1/12/2022

0 Comments

 
A 62 yo male with a previous history of paroxysmal atrial fibrillation presents to the emergency department with a rapid irregular heart beat and a complaint of palpitations, that started 2 hours previously.
His ECG is shown below.
Picture
The patient is haemodynamically stable and is not greatly distressed by the palpitations. He  is not on any anticoagulation.
Here are some important questions to answer in relation to this patient:
  1. Do we shock this patient now, or give the patient 24 hours to potentially self-revert?
  2. We know that if we shock early, we are doing so, to a number of patients who would self revert. Should we send the patient home and get them to come back the next day?
  3. Are there any risks in waiting  for 24 to 48 hours, or is the risk of stroke equal during the first 48 hours?
​Watch the video lecture below for all the answers (From Cardiac Bootcamp).
0 Comments

Type II Myocardial Injury

23/11/2022

0 Comments

 
A 78 yo woman with known moderate coronary artery disease, (with no previous interventions) and a history of controlled atrial fibrillation, presents with left sided chest pain.
Previous history includes hypertension. She is on a DOAC, and metoprolol and Perindopril.
She is haemodynamically stable.
​The ambulance have given aspirin and topical GTN. On arrival she is pain-free.
Her ECG is shown below. 
Picture
Blood tests are essentially normal, however the high sensitivity troponin is 89 ng/L (normal is <14). Is this a type I or type II Myocardial Injury(MI)? Differentiating the two can sometimes be very difficult.
MI is now far easier to detect with high sensitivity troponin. Troponin are very specific for MI, however they do not really give us the cause.

Myocardial infarction is caused by coronary thrombus, however non-thrombotic causes also exist. Type II MI is due to a mismatch between oxygen supply and demand and is due to causes other than atherothrombosis including:
  • Coronary artery spasm
  • Coronary embolism
  • Coronary artery dissection
  • Other specific causes
    • hypoxaemia
    • anaemia
    • hypotension
    • severe hypertension
    • Brady/tachyarrhythmias.
Differentiating between subtypes, of which there are 5, according to the 4th universal definition of MI, can be challenging.

Mortality Outcomes
Both short and long term mortality is higher in type II rather than type I MI. Predictors of poor survival in those patients with type II MI include:
  • Older age
  • Female
  • Heart failure
  • Shock
  • The presence of CAD
Troponin
Those patients with Type II MI usually have a lower peak troponin level.
A 20% change in Troponin differentiates between stable and dynamic troponin patterns.
There are some recommendations that a 50% change in troponin should be used for dynamic change and a 20% change used when the baseline value is substantially elevated.

Differentiating between Types I and II can be difficult, however in general, if there are signs and symptoms of ischaemia, type I MI should be diagnosed.

These patients should all be admitted.

Reference
DeFilippis A et al. Assessment and Treatment of Patients with Type 2 Myocardial Infarction and Acute Nonischemic Myocardial Injury. Circulation 2019;140:1661-1678
Members go to the Video page and watch the lecture on Type II Cardiac Injury
0 Comments
<<Previous

    Author

    Dr Peter Kas
    ​Emergency Physician

    Back to resus.com.au
    Picture
    Picture
    Sign up for
    ECG of the week
     Its free

    Archives

    May 2023
    March 2023
    February 2023
    January 2023
    December 2022
    November 2022
    October 2022
    September 2022
    August 2022
    July 2022
    June 2022
    March 2022
    December 2021
    November 2021
    October 2021
    September 2021
    August 2021
    July 2021
    June 2021
    May 2021
    April 2021
    March 2021
    February 2021
    January 2021
    December 2020
    November 2020
    September 2020
    August 2020
    July 2020

    Categories

    All
    Ablation
    Atrial Fibrillation
    Atrial Flutter
    Atrial Tachycardia
    Axis
    Bradycardia
    Cardiac Arrest
    Chest Pain
    ECG Mimics
    Ischaemia
    Lead Reversal
    Migraine
    Myopericarditis
    Pacing
    Paediatric Arrhythmias
    Paediatric ECG
    Paediatric Syncope
    Pericarditis
    QT Interval
    STEMI
    STEMI Mimics
    SVT
    T Waves
    Ventricular Tachycardia
    Wellens
    Wide Complex Tachycardia

Our Other Websites to Visit

www.emcore.com.au
www.resus.com.au

Contact Us
© COPYRIGHT 2015. ALL RIGHTS RESERVED.
  • HOME
  • Course Login
    • Log In
    • Log Out
  • SYLLABUS
  • STORE
    • Online Self Study Course
    • Cardiac Video Course
  • ECG OF THE WEEK